Context
The problem
Solar and wind payback estimates are usually locked behind installer sales funnels, and the free tools are either region-locked or guesswork. The data to do it properly (irradiance, weather, equipment performance) is publicly available; the question is whether a calculator's numbers can be trusted. Most never check theirs against a real installation.
Ownership
My role
Solo build: calculation engine, validation harness, data layer, and UI.
Solution
Approach
Physics models, not multipliers
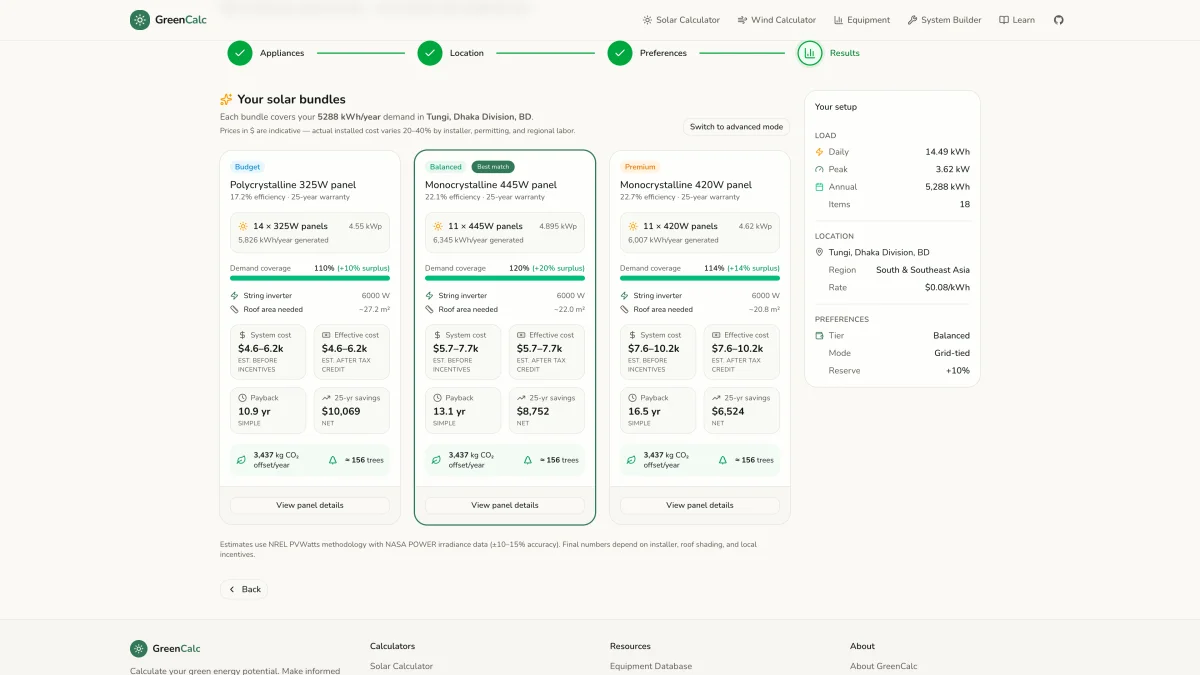
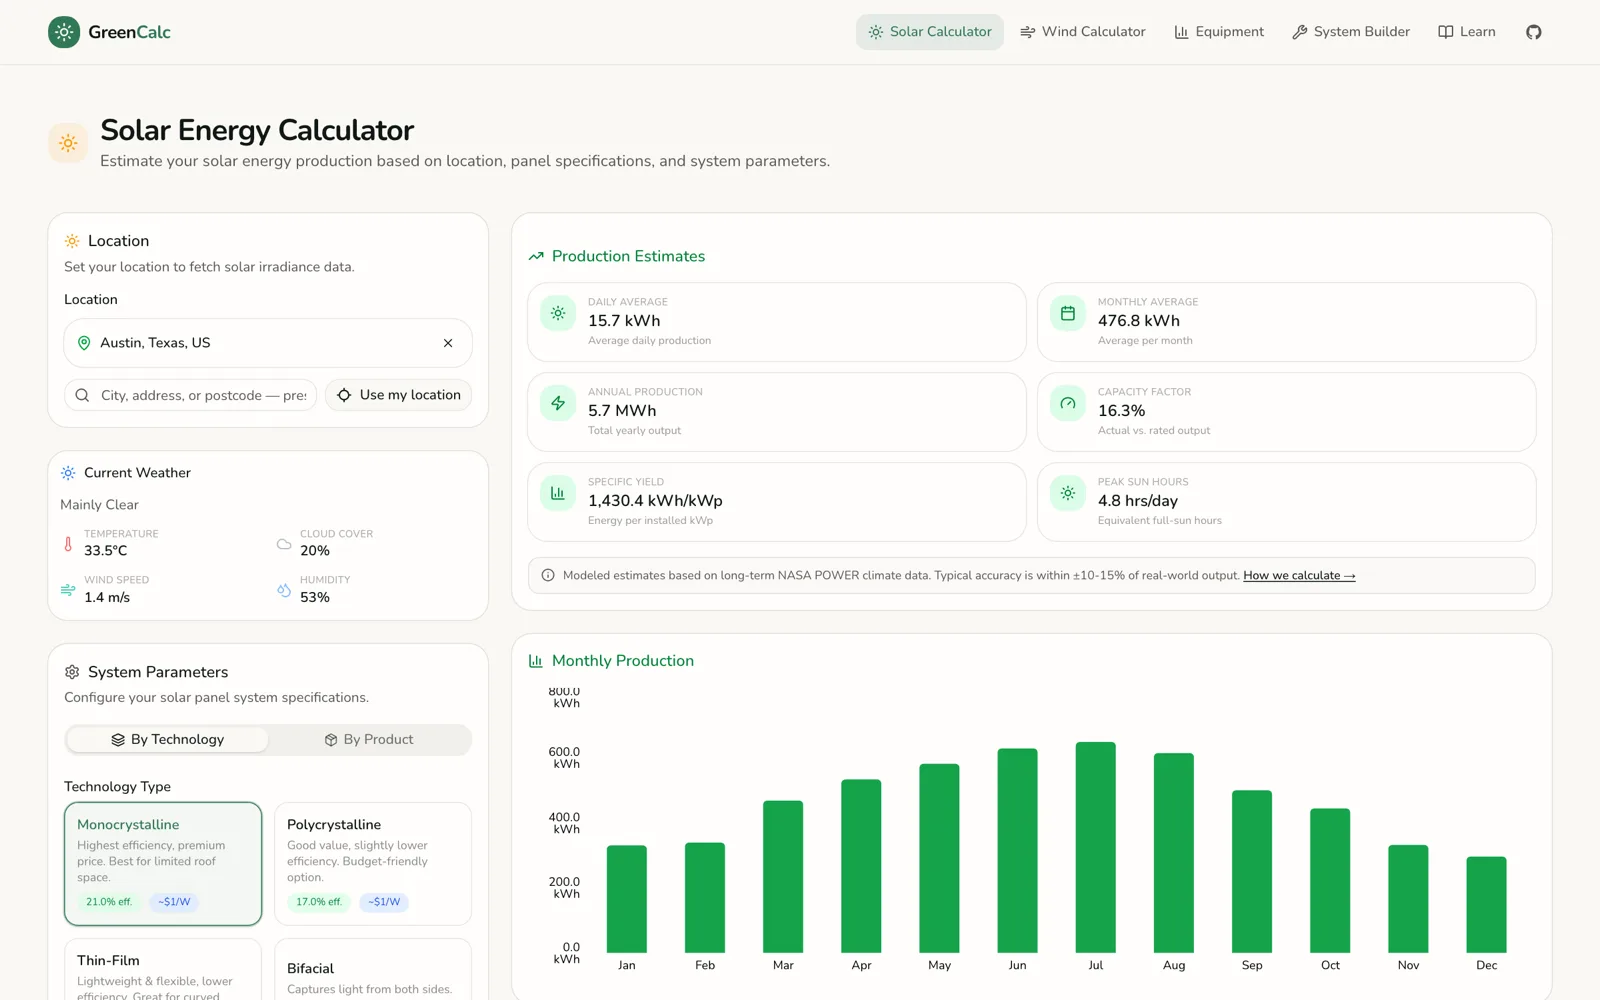
Solar output follows the NREL PVWatts methodology: rated power × peak sun hours with temperature derating, tilt/azimuth corrections, shading, and system losses. Wind uses the standard power-curve model (½ρAv³ with capacity and efficiency coefficients). Climate inputs come from NASA POWER 40-year climatology; ROI runs payback, NPV, and a 25-year cashflow with region-aware electricity rates.
Validated against real plants
The models are checked against real SCADA telemetry. The wind model runs against 50,000 ten-minute measurements from a 3.6 MW turbine and lands at −0.7% bias with mid-range RMSE under 3%. The solar model runs against 1,634 daytime points from an operating plant in India (−12.9% bias, conservative by design). The validation scripts ship in the repo against public Kaggle datasets, so anyone can rerun the numbers.
A data layer that can't lose its keys
All three upstream sources (NASA POWER, Open-Meteo, BigDataCloud geocoding) are keyless public APIs, wrapped in a fetch layer with timeouts and normalized error handling, cached with 24-hour TTLs for climatology and 10 minutes for weather, and every upstream response is Zod-validated before it touches a calculation.
Curated equipment, honest bundles
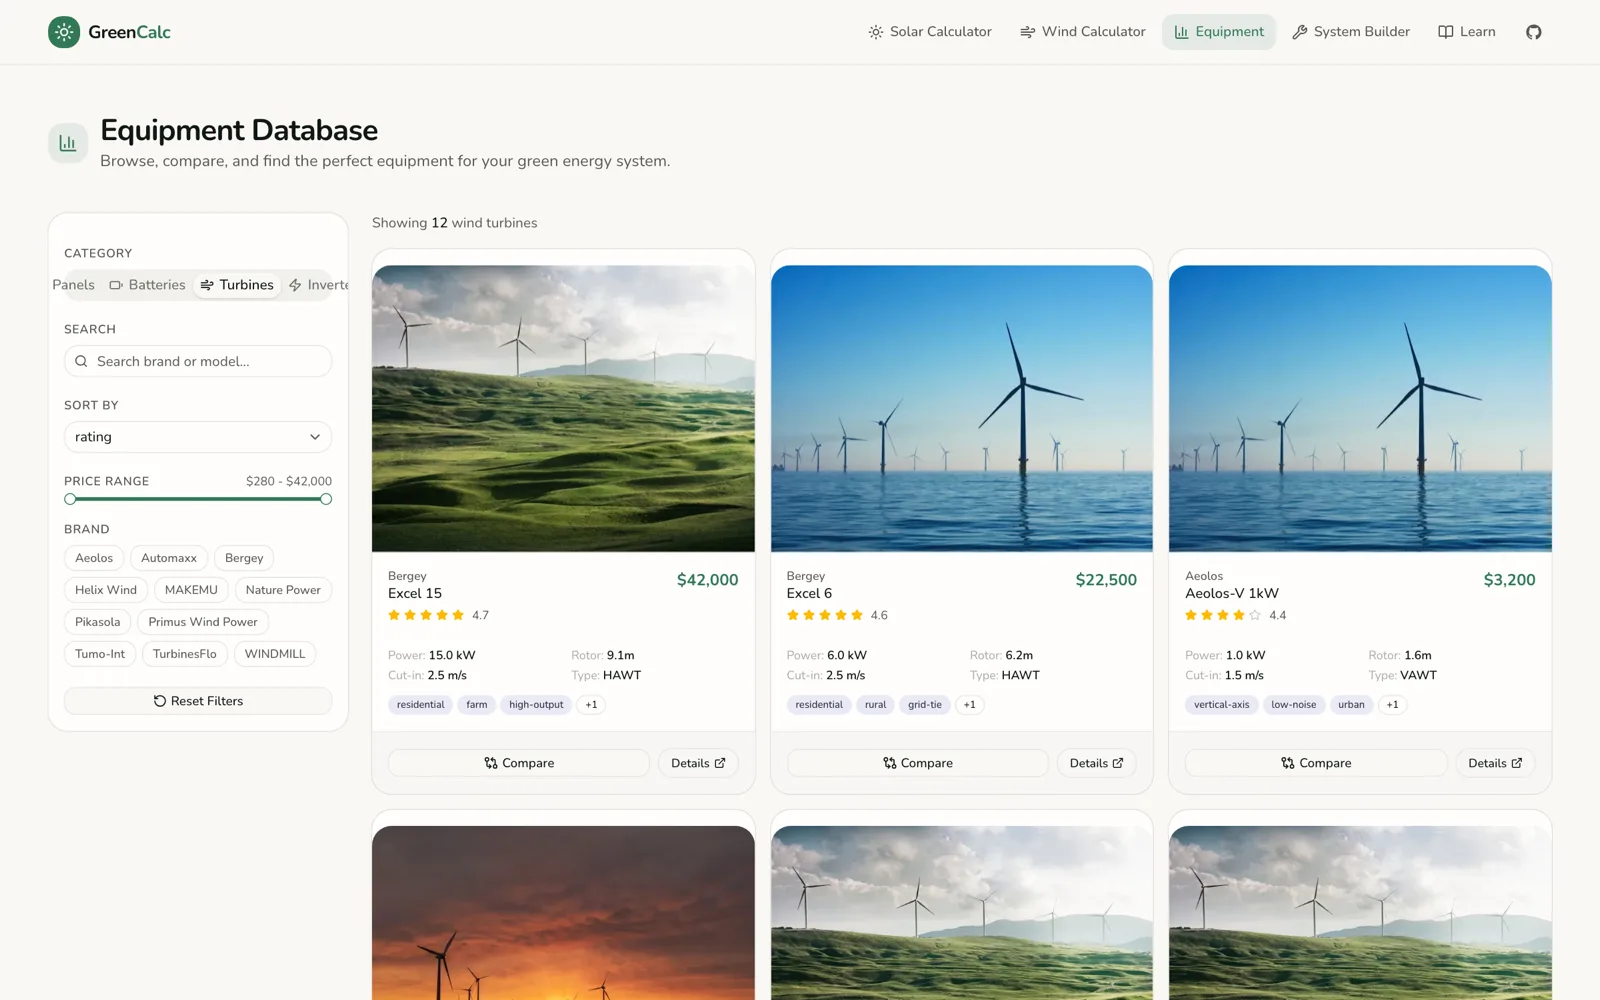
Equipment specs are hand-curated from manufacturer datasheets: 50+ panels, batteries, turbines, and inverters with region availability. System bundles are picked by price-per-watt monotonicity, so the budget tier is never secretly better value than premium.
System
Architecture
Next.js app with a Hono API mounted inside it, pure TypeScript calculation modules kept separate from I/O, Jotai for calculator state, and Recharts for output. Tested with Vitest; deployed on Vercel; no login, no funnel.
- Pure calculation modules (solar / wind / ROI) isolated from the data layer
- Keyless three-source data layer with TTL caching and Zod-validated responses
- Reproducible SCADA validation scripts in the repository
- Free and anonymous, no signup funnel
Results
Outcomes
50,000
SCADA measurements in the wind validation
−0.7%
wind model bias vs a real 3.6 MW turbine
3
keyless scientific data sources
50+
hand-curated equipment specs
- Free to use, live on Vercel.
- Validation is reproducible. Scripts and public datasets ship with the repo.
Contact
Get in touch.
If you're building something and want a hand, write to me. Same if you just want a second opinion on an architecture decision.
Prefer to talk? Grab 15 minutes in my calendar.